10 Cost Estimator & Calculator Components
Browse 10 cost estimator and pricing calculator components for React and Next.js — slider-based calculators, tiered pricing estimators, usage-based cost tools, and ROI calculators. Built with Shadcn UI and Tailwind CSS for SaaS conversion optimization.
SERP Blocks Team
Product
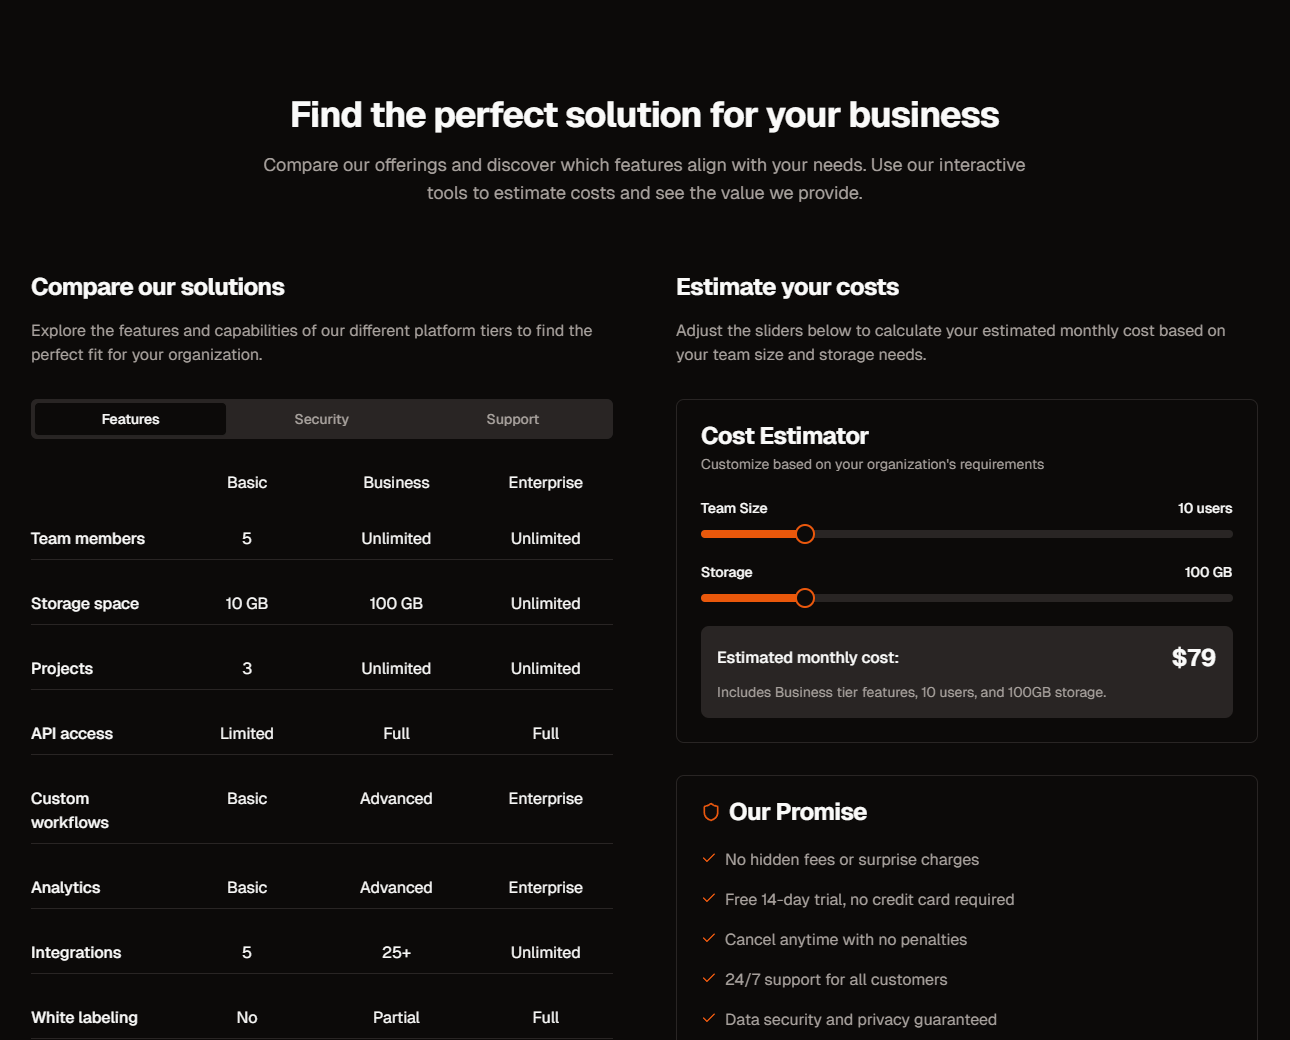
Static pricing pages answer the question "How much does it cost?" Interactive cost estimators answer a better question: "How much will it cost for me?" That distinction drives conversion. When a prospect can plug in their own numbers — team size, monthly usage, feature requirements — and see a personalized price, they stop comparing abstract tiers and start evaluating a concrete purchase decision. The mental shift from browsing to buying happens faster when the price feels personal.
Cost estimators also qualify leads. A visitor who spends two minutes adjusting sliders and reviewing their custom estimate is far more engaged than someone who glances at a pricing grid and bounces. They have self-identified their usage level, their budget expectations, and their feature priorities — all before talking to sales. For products with complex or usage-based pricing, an interactive estimator can replace dozens of pre-sales conversations.
The SERP Blocks cost estimator collection includes 10 cost estimator and calculator components built with Shadcn UI and Tailwind CSS. Slider-based calculators, tiered pricing estimators, usage-based cost tools, and ROI calculators — each designed to turn your pricing page from a static menu into an interactive sales tool.
Why Interactive Pricing Converts Better
The psychology behind interactive pricing is well documented. Three mechanisms drive the conversion lift.
The Endowment Effect
When users interact with a tool — moving sliders, toggling features, entering their own data — they develop a sense of ownership over the result. The estimate feels like "their" price, not a generic number on a page. This psychological ownership makes them more likely to follow through on the purchase because abandoning a personalized estimate feels like losing something they already have.
Research on interactive product configurators consistently shows 20-40 percent conversion lifts over static presentations. The same principle applies to pricing. A personalized estimate is more compelling than a generic tier because the user invested effort in creating it.
Reduced Uncertainty
Complex pricing creates friction. When a pricing page lists three tiers with different feature sets, usage limits, and add-on options, the prospect has to do mental math to figure out their actual cost. Mental math is effort, effort creates friction, and friction kills conversions.
An interactive estimator does the math for the prospect. They input their variables, and the component instantly shows their cost. No spreadsheets, no back-of-envelope calculations, no emailing sales to ask "What would it cost if we have 50 users but only need the advanced reporting add-on?" The certainty that comes from seeing a calculated price reduces the anxiety that delays purchase decisions.
Anchoring and Framing
Interactive estimators let you control how the price is framed. Instead of showing "$99/month," you can show "$3.30/day" or "$2 per user per month" or "Saves $14,000/year compared to manual processes." The calculator format gives you natural opportunities to present the price alongside the value — showing the cost per unit, the savings over alternatives, or the ROI over time.
These framing effects are not manipulation. They are communication. A prospect who sees that your product costs $500/month but saves 40 hours of manual work per month has the information they need to make a rational decision. A static price of "$500/month" without context forces them to calculate the value proposition themselves, and most will not bother.
Cost Estimator Component Patterns
The 10 SERP Blocks cost estimator components cover the primary patterns used by SaaS, infrastructure, and service businesses.
Slider-Based Calculators
The slider is the most intuitive input for variable pricing. Users drag a handle along a track to select a value — number of users, API calls per month, storage in gigabytes — and the estimated cost updates in real time. The physical gesture of dragging makes the relationship between input and output feel direct and understandable.
Effective slider calculators include:
Labeled tick marks — Show key values along the track (100, 500, 1,000, 5,000, 10,000) so users can orient themselves without precise positioning
Live value display — Show the current slider value above or beside the handle as the user drags
Instant price update — Recalculate the total price on every slider movement, not on release. The continuous feedback creates the interactive feeling that drives engagement
Logarithmic scales — For ranges that span orders of magnitude (100 to 1,000,000 API calls), use a logarithmic scale so that small values are not compressed into the leftmost pixel of the track
Slider calculators work best for products with one or two primary pricing variables. If your pricing depends on more than three inputs, sliders can make the interface feel cluttered. In that case, consider a form-based calculator with numeric inputs.
Tiered Pricing Estimators
Some products have discrete tiers — Starter, Professional, Enterprise — but within each tier, the cost varies based on usage or seat count. A tiered pricing estimator combines a tier selector with variable inputs, showing the user which tier fits their needs and what it costs at their scale.
This pattern works well for products where the tier determines the feature set and the variables determine the price within that tier. The user selects "Professional" because they need advanced reporting, then adjusts the user count slider to see the per-seat cost at their team size.
Tiered estimators also serve as upsell tools. When a user configures their needs and the estimator shows that they are close to the next tier's threshold, you can highlight the additional features they would unlock for a modest price increase. This contextual upselling is more effective than generic "Upgrade" prompts because it is tied to the user's specific situation.
For static tier comparisons that complement the interactive estimator, the SERP Blocks pricing collection includes 21 pricing page components with feature comparison tables, toggle switches for monthly/annual billing, and highlighted recommended plans.
Usage-Based Estimators
Infrastructure and API products often charge based on consumption — compute hours, API calls, bandwidth, storage, transactions. Usage-based estimators let prospects model their expected consumption and see the projected cost.
These components typically include multiple input fields for different billable dimensions:
Compute: CPU hours per month, instance type
Storage: Gigabytes stored, read/write operations
Network: Bandwidth in/out, CDN requests
API: Calls per month, payload size
Each input multiplies by a per-unit rate, and the component sums the line items into a total estimated monthly cost. A well-designed usage estimator also shows the cost breakdown by dimension, so users can see which aspect of their usage drives the most cost.
Usage-based estimators are particularly valuable for products competing with AWS, GCP, or Azure services, where prospects struggle to predict their cloud bill. A clear, simple estimator that takes five inputs and produces a monthly estimate removes one of the biggest barriers to adoption: pricing uncertainty.
ROI Calculators
ROI calculators flip the pricing conversation. Instead of asking "How much does it cost?" they ask "How much will you save?" Users input their current costs, time spent on manual processes, or revenue lost to inefficiency, and the calculator shows the return on investment from adopting your product.
A typical ROI calculator structure:
Current state inputs — Hours spent on manual processes, current tool costs, error rates, revenue impact of delays
Product impact assumptions — Time saved (usually pre-filled with conservative defaults based on customer data), error reduction, speed improvement
ROI output — Annual savings, payback period, three-year total value, net savings after product cost
ROI calculators are lead generation tools. The calculated result is personalized, high-value content that prospects want to save, share with their team, or present to management. Gating the full report behind an email form — "Enter your email to get a detailed PDF of your ROI analysis" — converts at significantly higher rates than generic newsletter signup forms because the prospect is trading their email for something they specifically created and want to keep.
The key to a credible ROI calculator is transparency about assumptions. Show the formulas, let users adjust the assumptions, and cite the data sources behind your default values. A calculator that produces suspiciously high ROI numbers with opaque math destroys trust instead of building it.
Lead Generation Through Interactive Tools
Interactive calculators are among the highest-converting lead generation tools available to SaaS marketers. They outperform static content because they provide immediate, personalized value — the user gets something useful (their cost estimate or ROI analysis) in exchange for their engagement and, optionally, their contact information.
Conversion Strategies
There are several approaches to converting calculator users into leads:
Ungated results, gated details. Show the headline number (total monthly cost, annual ROI) without any form. Offer a detailed breakdown, comparison report, or PDF summary in exchange for an email address. This approach maximizes calculator usage while still capturing leads from the most engaged visitors.
Progressive disclosure. Start with a simple calculator that requires minimal input. After the user sees their initial result, offer a "Get a more accurate estimate" option that asks additional questions and produces a refined number. The additional questions can include contact information positioned naturally alongside business-specific inputs.
Save and share. Let users save their calculation with a unique URL or download a summary. Saving requires account creation or email input. This works well for B2B products where the person researching pricing is not always the decision-maker — they need to share the estimate with their team.
Follow-up triggers. When a user completes a calculation that places them in a high-value segment (large team size, high usage volume, enterprise features selected), trigger a follow-up. This could be an in-app prompt to schedule a demo, an automated email with relevant case studies, or a notification to your sales team.
Pair your calculator with clear calls to action using components from the SERP Blocks CTA collection, which includes 32 CTA section designs that work alongside interactive tools to move prospects from estimation to action. For prospects who want to talk to your team after seeing their estimate, the SERP Blocks contact collection provides 33 contact form components.
Dynamic Pricing Display
Interactive cost estimators require thoughtful display of changing numbers. Static pricing pages can rely on fixed typography, but calculators need UI patterns that communicate updates clearly.
Animating Price Changes
When the price updates in response to user input, the transition should be visible but not distracting. Effective approaches include:
Count-up animation — The number increments from the old value to the new value over 200-300 milliseconds. This creates a slot-machine-like satisfaction and makes small changes visible that would be missed in an instant swap.
Highlight flash — The price briefly highlights (background color change or text weight increase) when it changes, then fades back. This draws attention to the update without requiring the user to watch the number itself.
Subtle scale — The price element scales up slightly (102-105%) on change and returns to normal size. This micro-animation signals the update through motion.
Avoid animating on every slider tick during active dragging. Update the displayed value continuously but reserve animations for when the user releases the slider or pauses dragging. Continuous animation during fast dragging creates visual noise.
Formatting Large Numbers
Cost estimators often produce numbers that span wide ranges — from $29/month for a solo user to $12,450/month for an enterprise team. Your formatting needs to handle this range gracefully:
Always include currency symbols and appropriate decimal places
Use thousand separators for amounts above 999
Consider switching units at thresholds: show "$49/month" for small amounts and "$2,940/year" or "$2.9k/year" for large amounts
Show per-unit costs alongside totals: "$124/month ($6.20/user)" gives context at every scale
Showing Cost Breakdowns
Transparency in pricing builds trust. When your estimator produces a total, show how it breaks down:
Line items for each pricing dimension (base price, per-seat cost, add-ons, usage charges)
Percentage contribution of each component (helps users identify the largest cost drivers)
Comparison to alternative tiers or plans (shows when upgrading to a higher tier would actually be cheaper)
Savings from annual billing or volume discounts
A detailed breakdown also reduces sticker shock. A total of $890/month sounds expensive in isolation. A breakdown showing $200 base + $12/seat x 40 seats + $210 in API usage explains the number and makes it easier to justify.
Implementation Considerations
Keeping Prices in Sync
The prices in your estimator must match your actual billing. Nothing destroys trust faster than a calculator that shows $99/month and a checkout page that charges $119. If your pricing data lives in a billing system (Stripe, Paddle, Chargebee), fetch the current rates from that system rather than hardcoding values in the component.
For products with complex pricing that changes frequently, consider building a pricing API that both your estimator and your billing system consume. A single source of truth prevents drift.
Handling Edge Cases
Interactive calculators need to handle inputs that your pricing model does not cover:
Minimum thresholds — If your product requires at least 5 seats, the slider should not go below 5
Maximum values — Enterprise usage that exceeds your standard pricing should trigger a "Contact sales for custom pricing" state, not a calculated number that you cannot honor
Volume discounts — If per-unit pricing decreases at certain thresholds, show the discount being applied so users understand the non-linear relationship
Currency conversion — If you serve international customers, consider adding a currency selector. Even approximate conversions are more helpful than forcing prospects to do their own math
Accessibility
Interactive calculators use sliders, toggles, and dynamic content — all of which require careful accessibility implementation:
Slider inputs need proper
aria-label,aria-valuemin,aria-valuemax, andaria-valuenowattributesPrice updates should use
aria-liveregions so screen readers announce changesAll interactions must be keyboard accessible — sliders should respond to arrow keys with reasonable step increments
Color-coded elements (tier highlights, savings indicators) need text alternatives for color-blind users
The Shadcn UI primitives used in SERP Blocks components include these accessibility attributes by default, but verify that your customizations maintain them.
Positioning Your Calculator in the Buyer Journey
A cost estimator serves different purposes depending on where it appears:
Pricing page — The primary location. Visitors on your pricing page are actively evaluating whether your product fits their budget. An interactive estimator accelerates their decision.
Landing pages — For paid campaigns targeting high-intent keywords ("project management software pricing"), embedding a calculator directly on the landing page reduces clicks to conversion.
Blog posts and content — Embedding a simple calculator in educational content ("How much does cloud hosting cost?") drives traffic from informational queries and captures early-funnel prospects.
Sales collateral — A shareable calculator link that sales reps can send to prospects replaces the back-and-forth of custom quote requests.
The SERP Blocks library includes 1,200+ components across 50+ categories — from the 10 cost estimator blocks to the complementary pricing, CTA, and contact components — giving you everything needed to build complete pricing experiences that convert browsers into buyers.
Making Price the Easy Part
The goal of a cost estimator is to remove price as a barrier. When prospects cannot figure out what your product costs, price becomes a source of anxiety and delay. When they can calculate their exact cost in 30 seconds, price becomes a resolved question, and their attention shifts to evaluating features, reading case studies, and scheduling demos — the activities that lead to signed contracts.
Choose a calculator pattern that matches your pricing model complexity, invest in clear number formatting and smooth interactions, and treat the component as a conversion tool, not just a utility. Your cost estimator is the bridge between "I'm interested" and "I'm ready to buy."
Browse all 10 cost estimator components at blocks.serp.co/blocks/cost-estimator. Each block ships as clean React and Next.js code built on Shadcn UI primitives — copy, paste, and customize to match your product's pricing model and brand.