20 Dashboard UI Components with Shadcn and Tailwind
Browse 20 dashboard layout designs for React and Next.js — stat cards, chart areas, sidebar navigation, data tables. Built with Shadcn UI and Tailwind CSS for SaaS apps.
SERP Blocks Team
Product
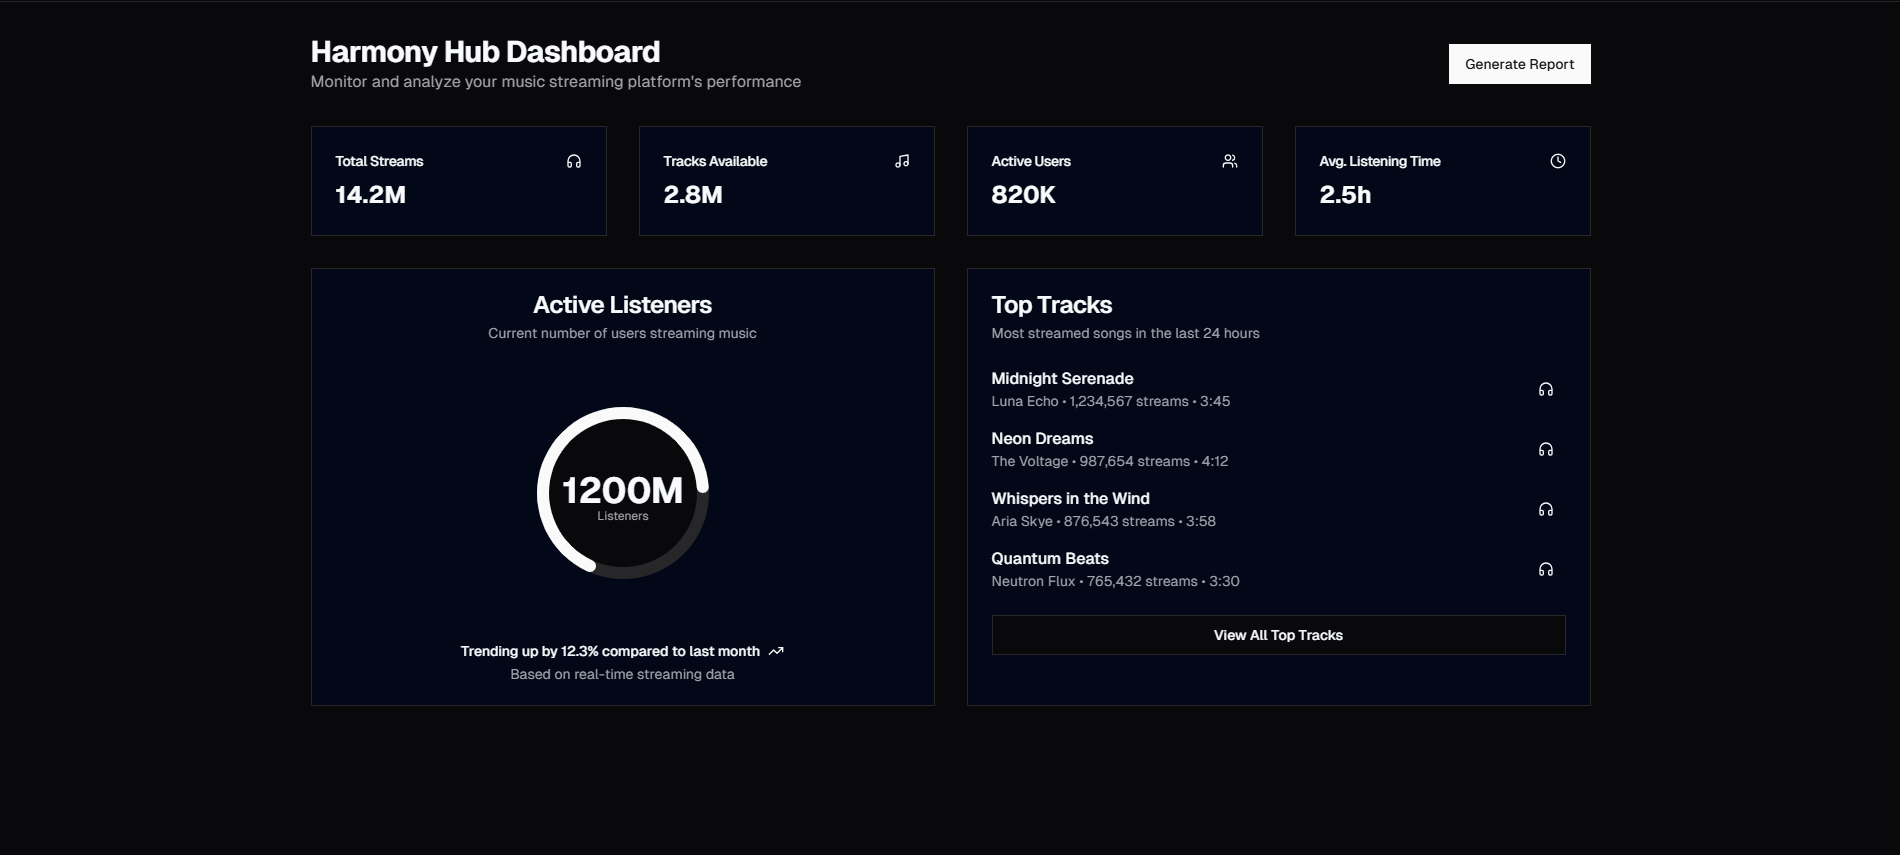
Building a dashboard from scratch is one of the most time-consuming tasks in frontend development. The layout, the sidebar, the stat cards, the charts, the data tables — each component needs to be designed, made responsive, themed for dark mode, and composed into a cohesive interface. It can easily take a week or more.
The SERP Blocks dashboard collection includes 20 complete dashboard layouts — not just individual cards, but full dashboard views with sidebar navigation, header areas, stat grids, chart sections, and data summaries already arranged and styled.
What Makes a Good Dashboard
A dashboard isn't just a collection of charts. It's an interface that helps users understand their data at a glance and take action based on what they see. The best dashboards share common traits:
Information hierarchy. The most important metrics are largest and highest on the page. Secondary data is smaller or lower. Users shouldn't have to search for the number that matters most.
Consistent visual language. All cards, charts, and tables use the same spacing, typography, and color system. Visual consistency reduces cognitive load — users learn the interface once and can navigate it intuitively.
Actionable context. Raw numbers are less useful than numbers with context. "Revenue: $42,500" is informative. "Revenue: $42,500 (+12% vs last month)" is actionable. The best dashboard components include comparison indicators, trends, and status labels.
Dashboard Layout Patterns
Overview Dashboards
Top-level summary views with a grid of stat cards, a main chart, and a recent activity or transaction list. These are the "home" view of any SaaS admin panel — the page users see when they log in.
Stat card grids typically show 3-4 key metrics: revenue, users, orders, conversion rate — whatever matters most for the business. Below the stats, a line or bar chart shows trends over time.
Analytics Dashboards
Data-heavy layouts with multiple charts, filter controls, date range pickers, and comparison views. These go deeper than overview dashboards, targeting users who need to explore and analyze data rather than just glance at it.
Variants include:
Multi-chart layouts with 2-3 charts in different formats (line, bar, pie)
Chart + data table combinations for drill-down analysis
Segmented views with tab or dropdown filters
E-commerce Dashboards
Tailored for online stores: order volume, revenue, average order value, top products, and recent orders table. The data cards focus on commercial metrics, and the layout emphasizes recent activity that might need attention (new orders, low stock alerts, pending reviews).
SaaS Dashboards
Focused on subscription metrics: MRR, churn rate, active users, trial conversions. These dashboards often include a funnel visualization showing the journey from signup to paid conversion, plus a list of recent signups or notable account changes.
Project Management Dashboards
Task-oriented layouts with status columns, progress bars, deadline trackers, and team assignment views. These are less about numbers and more about workflow visibility — showing what's in progress, what's blocked, and what's coming up.
Dashboard Building Blocks
Beyond the 20 complete layouts, several other SERP Blocks categories contribute to dashboard interfaces:
Admin Sidebars
The admin sidebar collection includes 10 sidebar navigation designs — collapsible, with icons, nested menus, user avatars, and notification badges. Every dashboard needs navigation, and the sidebar is the standard pattern for admin interfaces.
Data Tables
The table collection provides 17 table designs with sorting, filtering, pagination, and row selection. Tables are essential for any dashboard that displays list data — users, transactions, orders, logs.
Account Overview
The account overview collection offers 10 account summary layouts showing user profile, plan details, usage statistics, and billing information. These complement dashboards as the "my account" section of a SaaS app.
Settings Pages
The settings collection includes 10 settings page designs — profile forms, notification preferences, security settings, and team management. Every dashboard-based app needs a settings interface.
Cost Estimators
The cost estimator collection provides 10 pricing calculator designs with sliders, tier selectors, and dynamic price updates. These are useful for SaaS apps that offer usage-based pricing.
Technical Considerations
Chart Libraries
Dashboard blocks that include charts are designed to work with popular React charting libraries. Shadcn UI's Chart component is built on Recharts, which handles line, bar, area, pie, and radar charts with a consistent API.
Real-Time Data
Dashboard layouts are built as presentational components — they accept data as props and render it. Whether you fetch data with React Query, SWR, server actions, or WebSocket subscriptions, the blocks handle the display layer.
Performance
Dashboards with many charts can get heavy. Best practices include:
Lazy-loading charts below the fold with
next/dynamicUsing the
useMemohook for expensive data transformationsVirtualizing long data tables with libraries like TanStack Virtual
Limiting chart animation to initial load, not every re-render
Dark Mode
Every dashboard block supports dark mode. Chart colors, card backgrounds, sidebar navigation, and data table rows all adapt through Tailwind's dark mode utilities. This matters for dashboards because many users prefer dark mode for data-heavy interfaces — it's easier on the eyes during extended use.
Building a Complete Admin Panel
A full admin panel combines several SERP Blocks categories:
| Section | Block Category | Count |
| Sidebar | Admin Sidebar | 10 |
| Overview | Dashboard | 20 |
| Data Views | Table | 17 |
| User Account | Account Overview | 10 |
| Settings | Settings | 10 |
| Auth Screens | Login + Sign Up | 28 |
That's 95 blocks dedicated to admin and dashboard interfaces — enough to build a complete SaaS admin panel without designing a single component from scratch.
SERP Blocks includes 1200+ total blocks across 50+ categories. 60 are free, with the complete library available through a one-time Pro purchase.