12 Onboarding Flow Components for User Activation
Browse 12 onboarding flow components for React and Next.js — welcome screens, step wizards, progress checklists, feature tours, and activation prompts. Built with Shadcn UI and Tailwind CSS for SaaS user activation.
SERP Blocks Team
Product
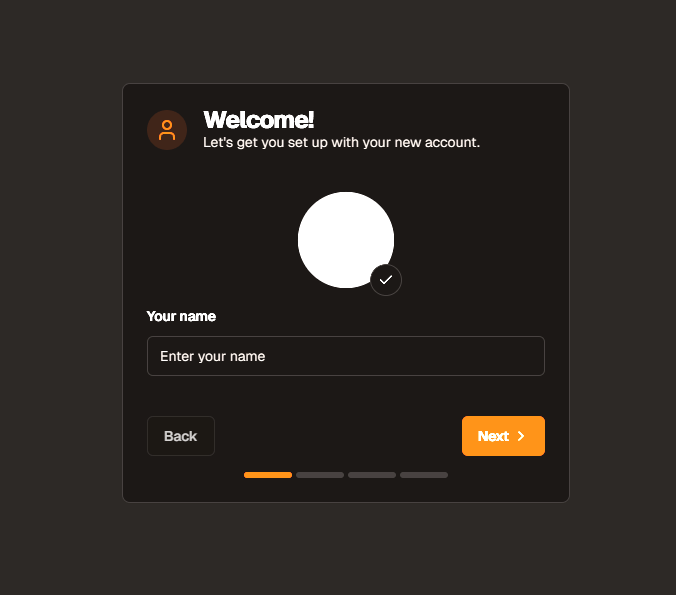
A user signs up for your SaaS product. They see a blank dashboard. They click around for thirty seconds, find nothing intuitive, and leave. They never come back. This is the single most expensive failure mode in SaaS — acquiring a user through marketing, converting them through a sign-up flow, and then losing them in the first five minutes because the product did not guide them to their first moment of value.
Onboarding is not a nice-to-have feature bolted on after launch. It is the bridge between sign-up and activation, and activation is the metric that predicts retention. Users who complete onboarding and reach their "aha moment" retain at 3-5x the rate of users who skip it. The difference between a 20% activation rate and a 60% activation rate is often nothing more than a well-designed onboarding flow.
The SERP Blocks onboarding collection includes 12 onboarding flow components built with Shadcn UI and Tailwind CSS. Welcome screens, multi-step wizards, progress checklists, feature tours, and activation prompts — each one designed around the principle that onboarding should feel like part of using the product, not a barrier before using it.
The Activation Rate Problem
Activation rate measures the percentage of new sign-ups who complete a key action that correlates with long-term retention. For a project management tool, activation might be "created a project and added a task." For an email marketing platform, it might be "sent the first campaign." For an analytics tool, it might be "installed the tracking code and viewed the first report."
Most SaaS products have activation rates between 20% and 40%. That means 60-80% of people who sign up never experience the product's core value. They signed up with intent, but friction, confusion, or distraction prevented them from reaching the moment where the product clicks.
Onboarding components address this by:
Reducing cognitive load — Instead of presenting every feature simultaneously, onboarding reveals the product progressively, showing only what the user needs at each step.
Providing clear direction — A blank dashboard offers infinite possibilities, which paradoxically means most users do nothing. A step wizard provides exactly one thing to do next, and users do it.
Building momentum — Completing an onboarding step feels like progress. Each completed step makes the user more invested in completing the next one. This is the psychological commitment principle in action.
Contextualizing features — A feature tour explains what a button does at the exact moment the user encounters it, not in a documentation page they will never read.
Onboarding Component Patterns
Welcome Screens
The first screen a user sees after sign-up. Welcome screens set expectations, establish tone, and provide the initial call to action that starts the onboarding journey.
Effective welcome screen elements:
Personalized greeting — "Welcome, Sarah" feels warmer than "Welcome to [Product]." If you collected the user's name during sign-up, use it immediately. This tiny personalization signals that the product recognizes the user as an individual.
Value proposition reminder — The user just signed up. Remind them why. "You are about to build your first email campaign" reinforces the intent they had when they signed up and directs that intent toward a specific first action.
Single primary action — "Let's get started," "Set up your workspace," "Create your first project." One button, one direction. Do not offer multiple paths on the welcome screen — decisions slow users down.
Estimated time — "This takes about 2 minutes" removes uncertainty. Users are more willing to start a process when they know how long it will take. Short time estimates reduce abandonment before the process even begins.
Skip option — Always available but visually de-emphasized. Some users are experienced with similar products and want to explore independently. Forcing them through onboarding creates frustration rather than value.
Welcome screens connect directly to the sign-up collection (11 blocks). The transition from sign-up completion to welcome screen should be seamless — a smooth animation or instant redirect that signals the user has successfully entered the product. No confirmation page, no "check your email" interruption (handle email verification in the background), no friction between the decision to sign up and the start of the experience.
Step Wizards
Multi-step flows that guide users through initial configuration. Each step collects information or prompts an action, with a progress indicator showing how far along the user is. Step wizards are the most structured onboarding pattern and work best when the product requires meaningful setup before it becomes useful.
Step wizard design principles:
3-5 steps maximum — Every additional step is an opportunity for the user to abandon the flow. Aim for 3 steps. Accept 4 if necessary. Beyond 5, users feel trapped in a process rather than making progress toward using the product.
One decision per step — Step 1: Choose your role. Step 2: Name your workspace. Step 3: Invite your team. Each step focuses on a single input or decision. Combining multiple decisions into one step saves clicks but increases cognitive load and abandonment.
Progressive disclosure — Each step reveals only the information relevant to that step. The user does not need to think about step 3 while completing step 1. This focus reduces anxiety about the overall process.
Visual progress indicator — A horizontal step bar, numbered circles, or a progress bar showing completion percentage. Users need to know where they are (step 2), where they came from (step 1 is complete), and where they are going (steps 3-4 remain). Without this context, the process feels unbounded.
Back navigation — Every step after the first includes a Back button. Users should be able to review and change previous answers. Trapping users in a forward-only flow creates anxiety about making the wrong choice.
Persistent state — If a user leaves the wizard mid-flow and returns later, their progress should be saved. Requiring users to restart from step 1 because they answered a Slack notification is a fast path to abandonment.
Step wizards handle the initial configuration that products need before they become useful. A CRM needs to know the user's industry and team size to provide relevant templates. An analytics tool needs the tracking code installed. A design tool needs the user to choose a canvas size or template. These mandatory setup actions are best handled through a wizard rather than dumped on the user as a list of things to figure out.
Progress Checklists
A persistent checklist that tracks onboarding completion across multiple sessions. Unlike step wizards (which are linear and immediate), checklists allow users to complete tasks in any order and at their own pace. The checklist appears in the sidebar, a modal, or a floating widget, showing which tasks are done and which remain.
Checklist design considerations:
Visible but not obstructive — The checklist should be present on every page during onboarding but should not block product usage. A small floating widget in the corner, a collapsible sidebar panel, or a progress bar in the header work well. A full-screen overlay that must be dismissed on every page load does not.
Task ordering — While users can complete tasks in any order, the checklist should suggest a logical sequence. Number the tasks or arrange them by recommended order. Most users will follow the suggested order even when they have freedom to deviate.
Completion animations — When a user completes a task, animate the checkbox with a satisfying checkmark animation. Visual reward for progress reinforces the behavior of continuing through the checklist. Small dopamine hits drive completion.
Completion percentage — "3 of 5 tasks complete (60%)" or a progress bar that fills as tasks are completed. Users near completion (80%+) are strongly motivated to finish — this is the goal gradient effect, where people accelerate toward a goal as they get closer to it.
Celebration state — When all tasks are complete, show a congratulatory message: "You are all set! Your workspace is fully configured." This marks the transition from onboarding to regular product usage and gives the user a sense of accomplishment.
Checklists integrate naturally with the dashboard collection (20 blocks). A new user's dashboard shows the checklist prominently — perhaps occupying the space where analytics will eventually appear once the product has data. As the user completes onboarding tasks and generates data, the checklist shrinks and the real dashboard content fills in.
Feature Tours
Guided tours that highlight specific UI elements with tooltips, spotlights, or coach marks. A feature tour draws attention to a button, input, or section of the page and explains what it does with a brief tooltip positioned adjacent to the highlighted element.
Feature tour patterns:
Sequential tours — Step-by-step walkthroughs where each tooltip points to a different element: "This is your project list" (next) "Click here to create a new project" (next) "This sidebar shows your team members." Each tooltip has Next and Skip buttons.
Spotlight overlays — The page darkens except for a circular cutout around the highlighted element. This dramatic visual treatment forces attention to the specific element being explained. Effective but intrusive — use sparingly.
Contextual tooltips — Tooltips that appear when a user first encounters a feature, not as part of a linear tour. The first time a user opens the settings page, a tooltip explains the notification preferences. The first time they view a report, a tooltip explains the date range selector. These just-in-time explanations are less overwhelming than a sequential tour.
Pulsing indicators — A subtle pulsing dot or ring on UI elements that the user has not yet discovered. No tooltip appears until the user interacts with the element. This pattern is the least intrusive — it suggests without explaining, trusting the user to explore.
Feature tours should be dismissible, skippable, and shown only once. Showing the same tour on every visit trains users to dismiss it reflexively, making them blind to genuinely new tours.
Activation Prompts
Targeted prompts that appear when a user has not completed a key activation action. Unlike sequential onboarding (which happens immediately after sign-up), activation prompts appear days or weeks later when data shows the user has stalled.
Activation prompt triggers:
Time-based — The user signed up 3 days ago but has not created their first project. Show a prompt: "Ready to create your first project? It takes less than a minute."
Behavior-based — The user has logged in 5 times but has never used the export feature. Show a prompt near the export button: "Did you know you can export reports as PDF?"
Milestone-based — The user has created 10 tasks but has not invited a team member. Show a prompt: "Working with a team? Invite members to collaborate on tasks."
Activation prompts work best when they feel helpful rather than pushy. They should offer value ("here is a feature that solves a problem you seem to have") rather than demand action ("complete your setup now"). The tone should be suggestive, the dismiss option should be obvious, and the prompt should not repeat after being dismissed.
Designing for First-Time User Experience
The first-time user experience (FTUX) is the complete sequence of interactions from sign-up to activation. Every decision in this sequence affects whether the user reaches their aha moment.
Reduce Time to Value
Time to value (TTV) measures how long it takes a new user to experience the product's core benefit. A shorter TTV means higher activation rates.
Strategies for reducing TTV:
Pre-populated data — Instead of presenting an empty workspace, pre-populate it with sample data. A project management tool can include a sample project with tasks. An analytics tool can show demo data. This lets users explore the product's features before investing in setup.
Templates — Offer templates that jumpstart the user's first real project. "Start with a Marketing Campaign template" is faster than "Create a blank project." Templates reduce decisions and provide structure.
Defer non-essential setup — Do not ask for a company logo, timezone, and notification preferences before the user has done anything. Collect only what is truly necessary (name, workspace name) and defer the rest to the settings collection (10 blocks) for later configuration.
Smart defaults — Every setting should have a sensible default. The user should not need to configure anything to start using the product. Settings exist for customization, not for initial configuration.
Progressive Disclosure
Progressive disclosure reveals complexity gradually, showing simple options first and advanced options only when the user is ready. In onboarding, this means:
Step 1: The simplest possible action — create a project, give it a name.
Step 2: The next level of complexity — add a task to the project, assign a due date.
Step 3: Collaboration — invite a team member, assign a task to them.
Later sessions: Advanced features — custom fields, automation rules, integrations.
Each layer builds on the previous one. The user never feels overwhelmed because they encounter complexity only after they have mastered the simpler layer beneath it.
This principle applies to navigation as well. The sidebar might initially show only 3-4 primary navigation items (Projects, Tasks, Team). As the user explores and becomes comfortable, additional items become visible (Reports, Integrations, Settings). The account overview collection (10 blocks) provides account management layouts that reveal configuration options progressively based on the user's experience level.
Empty State Design
Empty states are the screens users see before they have created any content. These are onboarding moments in disguise. Every empty state is an opportunity to guide the user toward their first action.
Effective empty states include:
Illustration — A friendly illustration that communicates "nothing here yet" without making the user feel lost. The illustration should depict the kind of content that will eventually fill this space.
Headline — "No projects yet" or "Your inbox is empty." Direct, factual, no judgment.
Description — A one-sentence explanation of what this section does and why the user would use it.
Primary action — A prominent button that creates the first item: "Create your first project," "Import your contacts," "Write your first post."
Secondary action — A link to documentation, a video tutorial, or a template gallery for users who want more context before acting.
Authentication to Onboarding Flow
The transition from authentication to onboarding is a critical handoff. The user has just completed sign-up — they are at peak motivation and minimum product familiarity. This is the highest-leverage moment in the entire user lifecycle.
The login collection (17 blocks) and sign-up collection (11 blocks) provide authentication components that lead directly into onboarding flows. The sign-up form collects credentials, the welcome screen greets the user, and the step wizard configures their workspace — all within a continuous flow that feels like a single, cohesive experience.
Design this transition carefully:
No dead ends — After sign-up completes, the user should land immediately on the welcome screen or first wizard step. Never show a generic "Account created" page with no clear next action.
Consistent visual language — The onboarding screens should share the same design system as the sign-up form. If the sign-up page uses a split layout with an illustration on the left and the form on the right, the onboarding wizard should continue this pattern. The login collection and onboarding collection use the same Shadcn UI primitives, ensuring visual consistency across the entire flow.
State persistence across authentication — If the user authenticated via social login (Google, GitHub), their name and avatar are already available. Pre-populate these in the onboarding wizard to skip redundant inputs and show the user that the product already knows who they are.
Measuring Onboarding Effectiveness
Onboarding is not a build-once-and-forget feature. It requires continuous measurement and iteration.
Key metrics:
Completion rate — What percentage of users who start onboarding finish it? Benchmark: 60-80%. Below 50% indicates the flow is too long, too confusing, or not valuable enough.
Step drop-off — Which specific step has the highest abandonment? If 40% of users drop off at step 3 of 5, that step needs simplification, better explanation, or removal.
Time to completion — How long does onboarding take? If the average is 8 minutes but you estimated 2, the flow is more complex than you think.
Activation rate — The ultimate metric. Of users who complete onboarding, what percentage reach the activation event? Compare this to the activation rate of users who skip onboarding to quantify the onboarding's impact.
7-day retention by cohort — Compare retention rates between users who completed onboarding, users who partially completed it, and users who skipped it. This data justifies continued investment in onboarding improvements.
Integration with Dashboard and Settings
After onboarding completes, users transition to the product's main interface. This transition should be seamless — the onboarding checklist shrinks, the welcome overlay closes, and the user lands on a populated dashboard (20 blocks) ready for regular use.
The settings collection (10 blocks) handles the configuration options that onboarding deferred. Notification preferences, integrations, billing details, and team management — these are important but not urgent, and showing them during onboarding would slow users down without adding value.
The account overview collection (10 blocks) provides the user's personal hub where they can see their profile, activity history, and subscription status. This is where the onboarding checklist might live permanently — available for review but no longer prominent once completed.
Related Block Categories
Onboarding components connect with authentication, dashboard, and account management blocks:
| Section | Category | Count |
| Onboarding Flows | Onboarding | 12 |
| Login Pages | Login | 17 |
| Sign-Up Pages | Sign Up | 11 |
| Dashboard Layouts | Dashboard | 20 |
| Settings Pages | Settings | 10 |
| Account Overview | Account Overview | 10 |
SERP Blocks includes 1200+ total blocks across 50+ categories. 60 are free, with the full library available through a one-time Pro purchase.