10 Stat Counter Components: Animated Number Displays
Browse 10 stat counter components for React and Next.js — count-up animations, icon stat cards, comparison metrics, progress indicators, and dashboard number displays. Built with Shadcn UI and Tailwind CSS for landing pages, dashboards, and social proof sections.
SERP Blocks Team
Product
Numbers tell stories that paragraphs cannot. When a visitor lands on your SaaS homepage and sees "12,000+ active teams" next to "99.9% uptime" next to "4.8 stars from 3,200 reviews," they absorb your credibility in under two seconds. No amount of copy can communicate trust as efficiently as a well-placed row of statistics. The numbers do the work. The design determines whether anyone notices them.
The problem is that most stat sections are built as afterthoughts. A developer drops three numbers into a flexbox row, slaps on some Tailwind utility classes, and calls it done. The numbers sit there, static and lifeless, looking like placeholder text that never got replaced. There is no visual weight, no animation to draw the eye, and no design hierarchy to guide the reader from the most important metric to the supporting ones.
The SERP Blocks stat collection includes 10 stat counter components built with Shadcn UI and Tailwind CSS. Count-up animations, icon-paired metric cards, comparison stats with trend indicators, progress rings, and dashboard number displays — each designed to make your numbers impossible to scroll past.
Why Stat Sections Work
The effectiveness of stat sections is rooted in how humans process information. Cognitive psychology research has consistently shown that numbers are processed faster than text, that specific numbers are more credible than round ones ("11,847 customers" beats "thousands of customers"), and that visual prominence increases recall.
On landing pages and marketing sites, stat sections serve three functions:
Social proof — User counts, customer logos, review scores, and satisfaction percentages tell visitors that other people have already trusted your product and had a good experience. Social proof is the most powerful persuasion tool on the web, and stats are its most efficient delivery mechanism.
Credibility markers — Uptime percentages, response time metrics, years in business, and team size establish that your company is stable and capable. These numbers answer the unspoken question: "Can I trust this company?"
Value quantification — "Save 12 hours per week" or "3x faster than manual processes" translates benefits into concrete terms. Abstract claims like "boost productivity" mean nothing. Specific numbers make the value tangible.
The SERP Blocks hero collection includes 81 hero sections, many of which incorporate stat counters directly below the main headline. This is one of the most effective landing page patterns: a bold value proposition headline, a supporting subheading, a CTA button, and immediately below, a row of three to four stats that provide instant credibility. The stats reinforce the headline's promise with evidence.
The 10 Stat Counter Components
The collection covers the full range of stat display patterns, from simple number rows to animated dashboard cards.
Count-Up Animation Stats
The signature stat component. Numbers animate from zero to their final value when the section scrolls into view, creating a moment of engagement that static numbers cannot match. The animation draws the eye and gives visitors a reason to pause and read the actual values.
Basic count-up row — Three or four stats in a horizontal row, each with a large animated number and a descriptive label below. The numbers count up simultaneously over 1.5 to 2 seconds using eased timing functions that start fast and decelerate toward the end. This deceleration creates a satisfying "landing" effect as each number reaches its final value. The component uses Intersection Observer to trigger the animation only when the section enters the viewport, preventing the animation from playing while the section is off-screen and invisible.
Count-up with prefix and suffix — Extends the basic count-up with support for dollar signs, percentage symbols, plus signs, and other formatting characters. "$2.4M" animates as the number counts from 0 to 2.4 while the dollar sign and "M" remain static. "99.9%" counts from 0 to 99.9 while the percentage symbol stays in place. The formatting characters do not animate because animating them alongside the numbers would create a jittery, unreadable display.
Icon Stat Cards
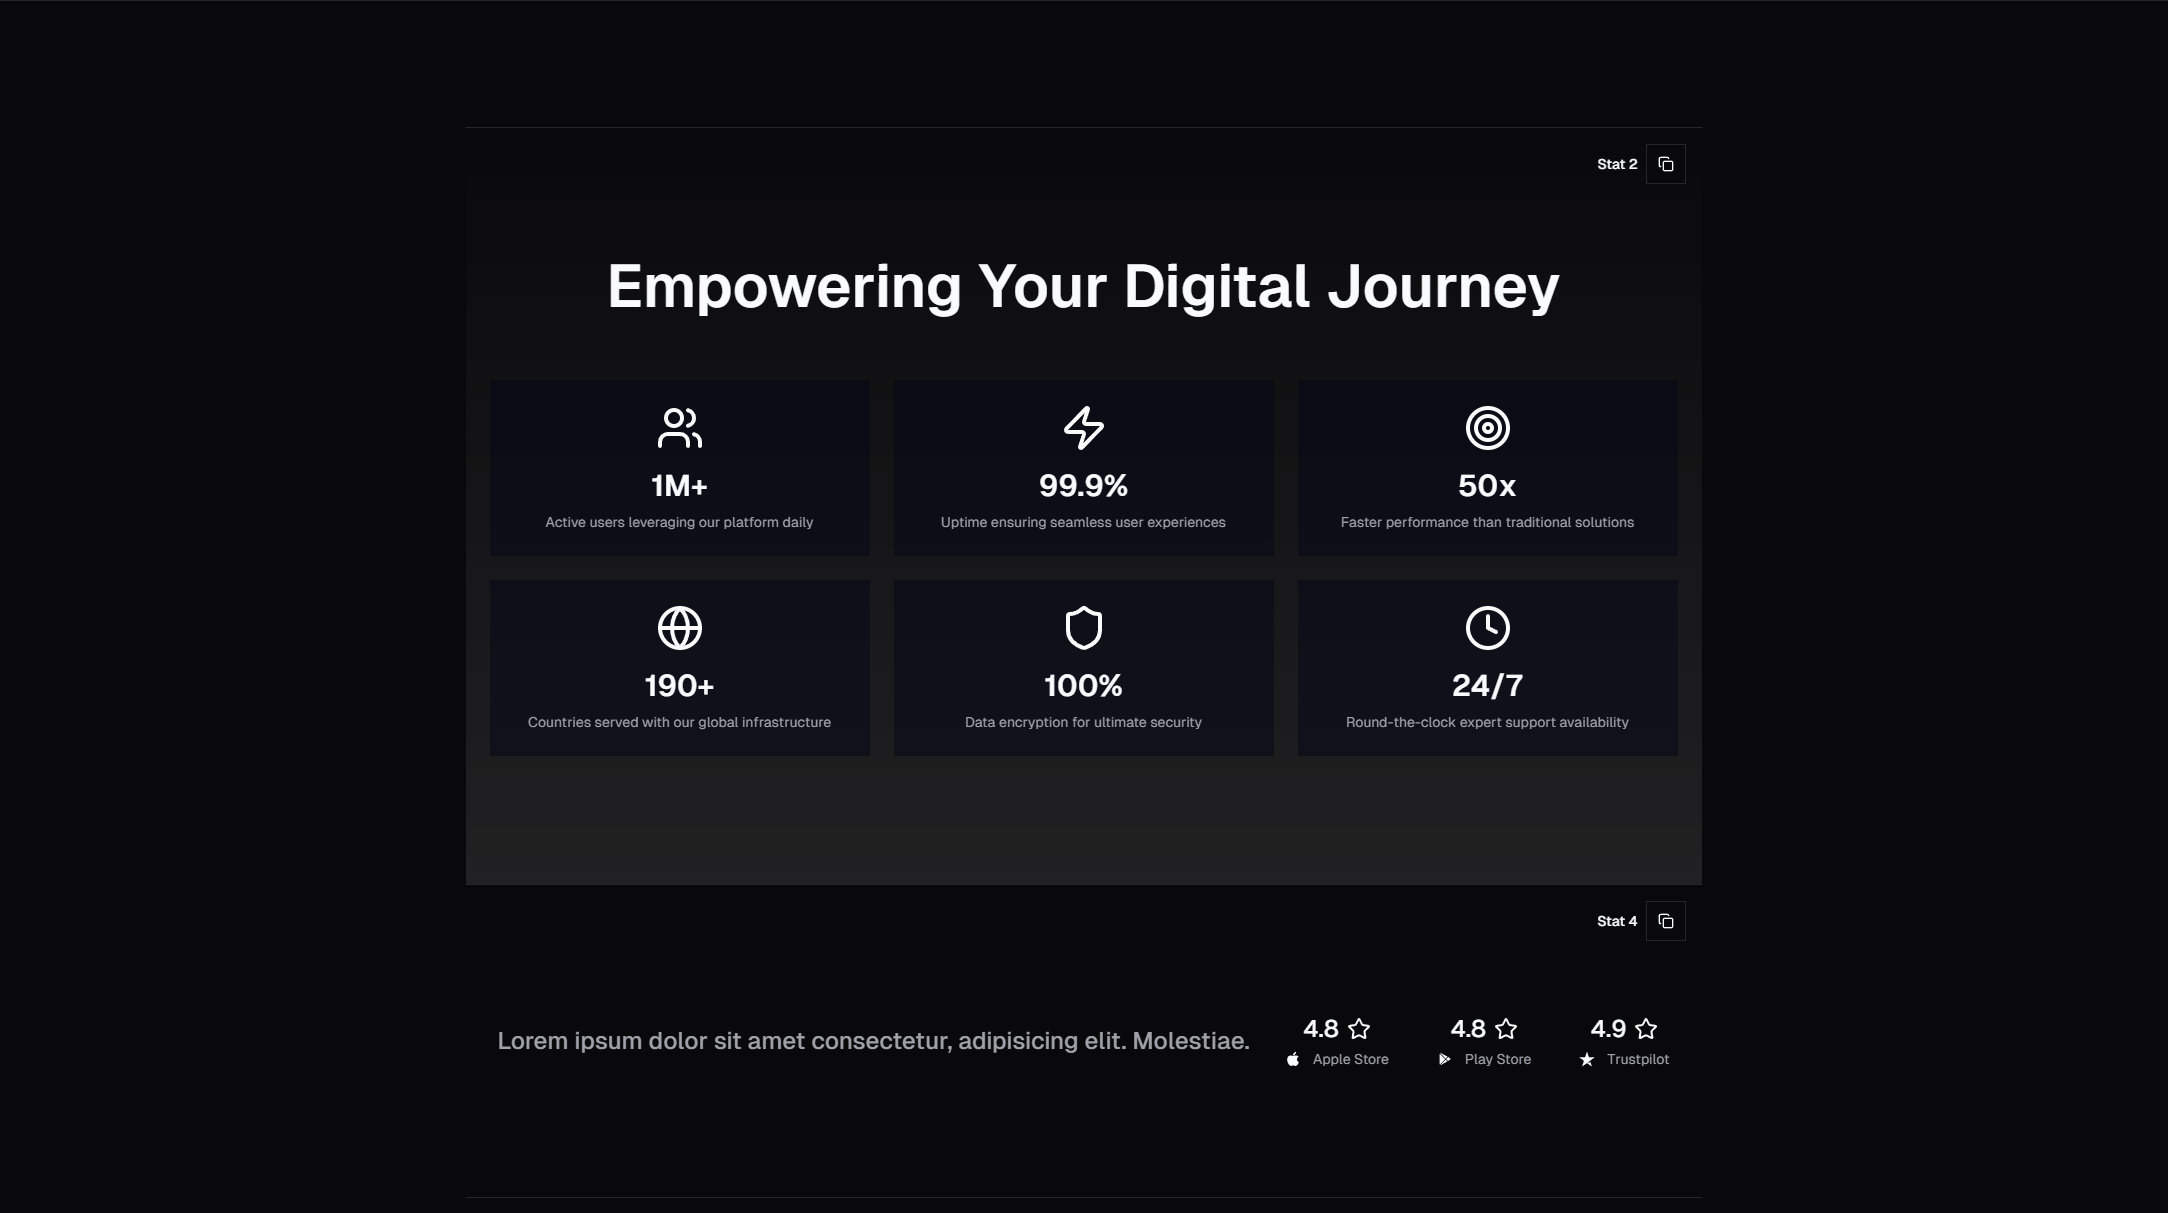
Stats with category icons — Each stat is paired with an icon that represents its category. A users icon for customer count. A clock icon for time saved. A globe icon for countries served. A shield icon for uptime. The icon provides a visual anchor that helps visitors identify what each number represents before reading the label. Icons are rendered in a colored circle or subtle background shape that matches the brand color palette.
Stats in card containers — Each stat occupies its own Shadcn Card component with a defined border and optional background. The card treatment creates clear visual separation between stats and works particularly well on pages where the stat section sits against a colored or image background that would make unbounded numbers hard to read. Cards also provide hover states — a subtle shadow lift or border color change — that add interactivity without overwhelming the content.
Comparison and Trend Stats
Stats with trend indicators — Each number includes a trend arrow (up or down) and a percentage change from the previous period. "Active Users: 12,847 with a green up-arrow and +14.2%." This pattern is borrowed from dashboard design and works well on marketing pages that want to communicate growth momentum. The trend indicators use semantic colors — green for positive trends and red for negative trends — with text labels that reinforce the direction for users who cannot distinguish the colors.
Before-and-after comparison stats — Two columns showing the "before" and "after" state. "Before SERP Blocks: 3 weeks to build a landing page. After: 2 hours." The comparison format makes value propositions concrete and specific. Each pair uses visual differentiation — the "before" column uses muted styling while the "after" column uses bold, highlighted styling — to make the improvement immediately obvious.
Dashboard Metric Cards
Metric card with sparkline — A stat number paired with a small inline chart (sparkline) showing the trend over time. The sparkline adds context that a single number cannot provide. "12,847 active users" with a sparkline showing steady upward growth tells a different story than the same number with a sparkline showing a recent decline from a peak. Sparklines are rendered as lightweight SVG paths, keeping the component performant without requiring a full charting library.
Metric card with progress ring — A circular progress indicator surrounding the stat number, showing how close a metric is to a goal or maximum. "87% SLA compliance" displayed inside a ring that is 87% filled creates a more engaging visual than the number alone. Progress rings work well for percentages, completion rates, and any metric that has a known maximum value. The ring animation — drawing from 0% to the target percentage — provides the same engagement benefit as count-up animation.
Specialty Stats
Stats with background illustrations — Large stat numbers overlaid on subtle background illustrations or abstract shapes that add visual depth. The illustrations are decorative and do not carry information — they exist to make the stat section visually distinctive and memorable. This variant works best on marketing pages and pitch decks where visual impact matters more than information density.
Full-width stat banner — A horizontal band that spans the full page width with stats distributed evenly across the available space. The banner uses a contrasting background color or gradient to separate it from the surrounding content sections. This layout is effective as a divider between major page sections — placed between the hero and the features section, or between the features section and the testimonials. The full-width treatment gives the stats maximum visual prominence.
Count-Up Animation: Implementation Details
The count-up animation is the most technically nuanced aspect of stat components. A good implementation needs to handle several requirements simultaneously.
Intersection Observer Triggering
The animation should start when the stat section enters the viewport, not when the page loads. If the stat section is below the fold (and it usually is), playing the animation on page load means it finishes before the user scrolls down to see it. The Intersection Observer API provides a performant, native solution for detecting when an element enters the viewport.
const useCountUp = (target: number, duration: number = 2000) => {
  const [count, setCount] = useState(0);
  const ref = useRef<HTMLDivElement>(null);
  const hasAnimated = useRef(false);

  useEffect(() => {
    const observer = new IntersectionObserver(
      ([entry]) => {
        if (entry.isIntersecting && !hasAnimated.current) {
          hasAnimated.current = true;
          animateCount(target, duration, setCount);
        }
      },
      { threshold: 0.2 }
    );

    if (ref.current) observer.observe(ref.current);
    return () => observer.disconnect();
  }, [target, duration]);

  return { count, ref };
};
The hasAnimated ref ensures the animation plays only once. Without this guard, the animation replays every time the user scrolls the section in and out of view, which is distracting rather than engaging.
The threshold: 0.2 setting means the animation triggers when 20% of the element is visible. This prevents the animation from starting when just a single pixel of the section peeks into view at the very bottom of the screen, where the user would miss it.
Easing Functions
Linear count-up animation — where the number increases at a constant rate — looks mechanical and unnatural. The human eye expects motion to follow physical laws: objects accelerate when starting and decelerate when stopping. Applying an easing function to the count-up creates this natural feel.
The ease-out curve (fast start, slow finish) works best for count-up animations because it creates a sense of momentum that gradually settles. The number races upward at first, capturing attention, then slows down as it approaches the final value, giving the reader time to register and remember the number.
function easeOutQuad(t: number): number {
  return t * (2 - t);
}
Reduced Motion Preferences
Users with vestibular disorders can experience discomfort from on-screen motion. The prefers-reduced-motion media query indicates when a user has requested minimal animation. When active, the stat component should display final numbers immediately without count-up animation. Check this preference before setting up the Intersection Observer — if the user prefers reduced motion, skip observation entirely and render the final value on mount. The numbers should still be fully visible and styled. Reduced motion means no animation, not a degraded experience.
Number Formatting
Raw numbers are harder to read than formatted ones. "12847" requires mental parsing to understand the magnitude, while "12,847" is instantly clear. The Intl.NumberFormat API handles locale-aware number formatting without manual string manipulation. For international audiences, the locale parameter determines whether thousands are separated by commas (US/UK), periods (Germany), or spaces (France). Decimal precision also matters for percentages and monetary values — "99.9%" should not round to "100%" during animation or at the final value. Use Intl.NumberFormat options to control minimum and maximum fraction digits.
Stat Section Design Principles
Visual Weight Matches Importance
The most important stat should have the most visual weight. If your key metric is customer count, make that number larger, bolder, or more prominently positioned than supporting metrics like satisfaction score or response time. Equal-weight stats work when all metrics are equally important (a common case for social proof rows), but when there is a clear hierarchy, the design should reflect it.
Labels Are as Important as Numbers
"12,847" without context is meaningless. "12,847 active teams" is a credibility signal. "12,847 active teams across 94 countries" is a compelling story. The label below each stat number does the interpretive work, telling the visitor what the number means and why they should care. Labels should be concise (three to five words), specific (not "users" but "active teams"), and benefit-oriented where possible (not "emails sent" but "emails delivered successfully").
Three to Four Stats Is the Sweet Spot
One stat feels lonely and makes the section look empty. Two stats look unbalanced unless they are a deliberate comparison pair. Three stats create a natural rhythm and fit comfortably across most viewport widths. Four stats are the maximum for a single row before the numbers start competing for attention and the labels get truncated on smaller screens. Five or more stats should be split into two rows or restructured as a different component (a table, a grid, or a dashboard layout).
The SERP Blocks dashboard collection includes 20 dashboard components designed for higher-density metric displays. When you need to show six, eight, or twelve metrics simultaneously, a dashboard layout with multiple cards, sections, and visual groupings is more appropriate than a stat row.
Stats in Context: Landing Page Placement
The placement of your stat section on the page affects its impact. There are three proven positions:
Below the hero — The most common and most effective position. The hero makes the promise ("Build faster with pre-built components"). The stat section immediately below provides evidence ("1,200+ blocks, 55+ categories, 10,000+ developers"). This placement catches visitors at their highest attention level, right after they read the headline and before they scroll into feature details.
Between major sections — A stat banner between features and testimonials serves as a visual breather and credibility checkpoint, priming visitors to view testimonials as representative rather than cherry-picked.
Above the CTA — A stat section immediately above the final call-to-action reinforces the decision. "Join 12,847 teams who ship faster" above a "Start Free Trial" button combines social proof with conversion.
Stats on About Pages
About pages are another natural home for stat sections. Company metrics — founding year, team size, customers served, countries reached — establish scale and maturity. The SERP Blocks about collection includes 32 about page sections, and pairing an about hero with a stat row below is one of the most effective patterns for communicating company credibility. Choose metrics based on audience intent: landing page stats should emphasize product value (time saved, satisfaction scores), while about page stats should emphasize company strength (years in business, team size, customer count).
Performance Considerations
Count-up animations should use requestAnimationFrame rather than setInterval or setTimeout. The requestAnimationFrame API synchronizes with the browser's repaint cycle, producing smoother animation at 60 frames per second without blocking the main thread. For sparkline charts, render them as SVG rather than Canvas — SVG sparklines are resolution-independent, accessible, and performant for the small data sets that sparklines represent. If your stat section includes background illustrations, use modern image formats (WebP or AVIF) and appropriate sizing to keep the section lightweight.
Getting Started
The complete stat counter collection is available at blocks.serp.co/blocks/stat. All 10 components are built with Shadcn UI primitives and Tailwind CSS utility classes, rendering in React and Next.js with code available for Next.js, Astro, and Vue.
SERP Blocks includes over 1,200 blocks across 55+ categories. 60 blocks are free to use immediately. For access to the full library — including all 10 stat counter components, 81 hero sections, 20 dashboard layouts, and 32 about page sections — the Pro plan is a one-time purchase with lifetime access and no recurring fees. Every block ships as clean, production-ready source code that you own and customize without restrictions.